

Data pipeline observability is the practice of collecting, correlating, and acting on telemetry signals across every stage of a pipeline so that engineering teams can detect, diagnose, and resolve data failures faster than downstream consumers notice them. The primary benefit for a production data team is shorter root-cause analysis cycles and reduced business impact when something breaks.
The core signals observability systems track are:
- Freshness: Is data arriving and updating on schedule?
- Schema: Have column types, names, or structures changed unexpectedly?
- Distribution and volume: Are row counts, null rates, and value ranges within expected bounds?
- Lineage: Which upstream sources and downstream consumers does each dataset touch?
Pro Tip: Start with freshness and volume checks on your most business-critical tables before adding schema or distribution monitors. These two signals catch the majority of production incidents with the least instrumentation overhead.
Key Takeaways
Data pipeline observability reduces mean time to detect and repair by correlating freshness, schema, volume, and lineage signals into actionable, owner-routed alerts rather than generic alarms.
| Point | Details |
|---|---|
| Start with ownership | Assign a named owner to every dataset before instrumenting anything. |
| Instrument in phases | Begin with freshness and volume on one high-criticality pipeline, then expand. |
| Route alerts with context | Every alert must include run ID, error message, lineage link, and a runbook reference. |
| Government pipelines need provenance | Preserve originals, use dual-column patterns, and log run IDs for audit compliance. |
| Primereadysub for public-sector scope | Rutledge & Associates delivers outcome-owned observability implementations for government agencies and prime contractors. |
Table of Contents
- Why does data pipeline observability matter for your production systems?
- What are the core pillars of data pipeline observability?
- How does observability differ from monitoring and data quality tools?
- How does observability work technically inside a data pipeline?
- How to implement observability in your production pipelines
- Which tools support data pipeline observability?
- What common data problems does observability actually find?
- Operational practices for alert routing, ownership, and auditability
- Technical and organizational challenges to plan for
- How do you measure whether observability is working?
- Your one-week plan for getting started with observability
- Real-world cases where observability changed outcomes
- A practitioner's perspective on observability at scale
- Primereadysub delivers outcome-owned observability for government pipelines
- Sources
Why does data pipeline observability matter for your production systems?
Pipeline failures rarely announce themselves loudly. A broken dashboard, a feature store serving stale embeddings, or a compliance report built on duplicated records can persist for hours before anyone files a ticket. The engineering and business consequences compound quickly.
Consider three concrete failure modes that observability prevents or shortens:
- Broken BI dashboards: A schema change in a source table silently drops a join key. Analysts report wrong revenue figures to leadership before the pipeline team knows anything failed.
- ML model drift: A distributional shift in training data goes undetected because no monitor checks column statistics. The model degrades over weeks without a single alert firing.
- Compliance audit exposure: A government agency's benefit-eligibility pipeline processes a partial file load. Without lineage tracking, auditors cannot reconstruct which records were affected or when.
Real production outages at major cloud providers have demonstrated how upstream infrastructure failures cascade through dependent data pipelines, making run identity and retry planning non-negotiable design requirements. A single AWS regional event can invalidate hours of downstream computation if pipelines lack independent provenance records.
The business case is straightforward: teams without pipeline observability spend the majority of incident time on diagnosis rather than remediation. Observability compresses that diagnostic window by surfacing context alongside the alert.
What are the core pillars of data pipeline observability?
The six pillars data engineers must instrument are freshness, schema, distribution and volume, lineage, metadata and metrics, and logs and traces. Each pillar maps to a distinct class of failure mode, and together they provide the telemetry surface needed for end-to-end visibility.
Splunk's observability primer defines these signal categories as the foundation for detecting issues that static threshold monitors cannot catch. Here is what each pillar reveals in practice:
- Freshness: Detects staleness caused by upstream API throttling, scheduler failures, or network partitions. The signal is a missing heartbeat or a last-updated timestamp that exceeds the expected interval.
- Schema: Catches column additions, deletions, type changes, and renamed fields before they break downstream queries. Particularly critical when source systems are owned by external teams.
- Distribution and volume: Surfaces row count anomalies, null rate spikes, and value range violations that indicate partial writes, upstream data quality issues, or logic errors in transforms.
- Lineage: Maps the dependency graph from raw source to serving layer. Without lineage, impact assessment during an incident is guesswork.
- Metadata and metrics: Captures run duration, query cost, bytes processed, and model execution time. These signals reveal performance regressions and cost anomalies before they become SLA breaches.
- Logs and traces: Provide the execution context needed for root-cause analysis: error messages, stack traces, task durations, and retry counts at each pipeline stage.
dbt Labs documents that collecting run artifacts, manifests, and warehouse query history unlocks model-level performance insights and supports lineage-based diagnosis across the transformation layer specifically.
Minimal telemetry to record at each stage:
| Pipeline Stage | Minimum Telemetry |
|---|---|
| Ingest | Row count, source timestamp, file checksum, error count |
| Transform | Run duration, rows in/out, dbt manifest hash, test results |
| Materialize | Partition count, bytes written, query cost, last-refresh time |
| Serve | Query latency, cache hit rate, freshness age, consumer count |
Pro Tip: Capture dbt run artifacts (manifest.json, run_results.json) after every production run and store them in a queryable location. They are the cheapest lineage record you will ever generate.
How does observability differ from monitoring and data quality tools?
Monitoring flags known failures through static thresholds and predefined checks. Observability correlates broad telemetry and dynamic anomaly detection to explain what broke, where, and why. DQLabs frames this distinction clearly: monitoring tells you the alarm fired; observability tells you the cause and the blast radius.
Data quality tooling occupies a third position. It validates data against business rules at a point in time but does not track pipeline execution context or lineage across runs.
| Dimension | Monitoring | Data Quality | Observability |
|---|---|---|---|
| Detection style | Static thresholds, known checks | Rule-based validation | Dynamic anomaly detection |
| Signals | Metrics, uptime, SLA timers | Schema, nulls, referential integrity | Metrics, logs, lineage, traces, ML anomalies |
| Scope | Infrastructure and pipeline health | Dataset correctness | End-to-end pipeline behavior |
| Primary output | Alert: something failed | Report: data violates a rule | Diagnosis: what failed, why, and what it affects |
| Blind spot | Silent data corruption | Execution context | Requires instrumentation investment |
When to use each approach:
- Monitoring alone works for simple, well-understood pipelines with stable schemas and predictable volumes where known failure modes can be enumerated in advance.
- Data quality tooling is the right addition when business rules need formal validation and auditability, particularly for regulated datasets.
- Observability becomes necessary when pipelines are complex, multi-stage, or feed ML systems and dashboards where silent failures carry high business cost. It is complementary to both monitoring and data quality tools, not a replacement.
How does observability work technically inside a data pipeline?
The essential mechanism is: ingest telemetry from every pipeline stage, correlate it against a lineage graph, apply anomaly detection, and route actionable events to the right owner with enough context to act. That sequence transforms raw signals into decisions.
A reference architecture for pipeline observability includes these layers:
- Collectors: Agents or hooks at each stage (Kafka consumer groups, dbt callbacks, orchestrator task metadata, warehouse query logs) that emit structured telemetry events.
- Metadata store: A centralized catalog that holds schema history, run records, and ownership mappings. Apache Atlas, DataHub, or a custom Postgres schema all serve this role.
- Lineage graph: A directed acyclic graph connecting sources, transformations, and consumers. Column-level lineage is the most useful granularity for impact analysis.
- Anomaly engine: Statistical models or ML-based detectors that establish baselines and flag deviations in freshness, volume, or distribution without requiring manual threshold configuration.
- Alert router: Routes enriched alerts to the owning team with error context, timestamps, and lineage links rather than broadcasting generic notifications.
Concrete artifacts to capture at runtime:
- Query history from the data warehouse (BigQuery INFORMATION_SCHEMA, Snowflake QUERY_HISTORY, Databricks system tables)
- dbt manifest.json and run_results.json after every production run
- Orchestrator task logs and run metadata (Airflow XComs, Prefect state events)
- Column-level statistics (row count, null count, min, max, distinct count) per partition
- Apache Kafka consumer lag, partition offsets, and retention metrics for streaming pipelines
Confluent's documentation on streaming telemetry patterns shows how consumer lag and partition skew are the primary transport-layer signals observability systems should ingest from Kafka-based architectures.
Pro Tip: Implement run identity as a UUID attached to every pipeline execution and written into output tables as a metadata column. This single practice makes backfill validation and audit reconstruction dramatically faster.
A practical example stack: Kafka handles streaming ingest and surfaces lag metrics; dbt manages transformations and emits run artifacts; Databricks or a cloud warehouse stores materialized outputs and query history; OpenTelemetry collects traces across services; Great Expectations runs point-in-time data quality checks; and a metadata catalog stitches lineage across all layers.

How to implement observability in your production pipelines
The recommended phased approach is: instrument one pipeline, establish baselines, configure detection, automate alert routing, then iterate across the estate. Attempting to instrument everything simultaneously produces noise before it produces signal.
Phase 1: Instrument (Days 1–7)
- Select one high-value, high-risk pipeline as the pilot.
- Add freshness and row-count logging at the ingest and materialize stages.
- Capture dbt run artifacts and store them in a queryable table or object store.
- Assign a named owner to every dataset the pipeline produces.
Phase 2: Baseline (Days 8–14)
- Run the pipeline for at least seven days without alerting to collect baseline distributions.
- Compute expected ranges for row count, null rate, and run duration per partition.
- Document the expected refresh schedule as a formal SLA (e.g., "table X refreshed by 6:00 AM ET daily").
Phase 3: Detect (Days 15–21)
- Configure freshness alerts triggered when the last-updated timestamp exceeds the SLA window.
- Add volume anomaly detection using the baselines from Phase 2.
- Enable schema change detection on all tables the pipeline writes.
Phase 4: Automate and route (Days 22–30)
- Route alerts to the dataset owner, not a shared channel, with error message, timestamp, and lineage link included.
- Integrate alerts with your incident management tool (PagerDuty, OpsGenie, or Slack with structured payloads).
- Add a runbook link to every alert so the on-call engineer has immediate context.
Phase 5: Iterate
- Convert recurring anomalies into permanent dbt tests to create a self-improving quality loop.
- Expand instrumentation to adjacent pipelines using the same ownership and SLA model.
- Review false-positive rates monthly and adjust anomaly thresholds.
Operational notes worth preserving from the start:
- Every pipeline run should carry a unique run ID written into output metadata.
- Backfill and replay jobs need separate run identities from scheduled runs to avoid lineage confusion.
- Rollback plans should specify which tables are safe to truncate-and-reload versus which require append-only patterns for auditability.
Pro Tip: When alert volume exceeds what the team can act on in a shift, the first fix is routing, not suppression. Add owner tags to every dataset and let the alerting layer filter by tag before touching thresholds.
For government pipelines specifically, compliance documentation practices require that every transform be reproducible and that original values be preserved alongside derived ones. Build that requirement into Phase 1, not as a retrofit.
Which tools support data pipeline observability?
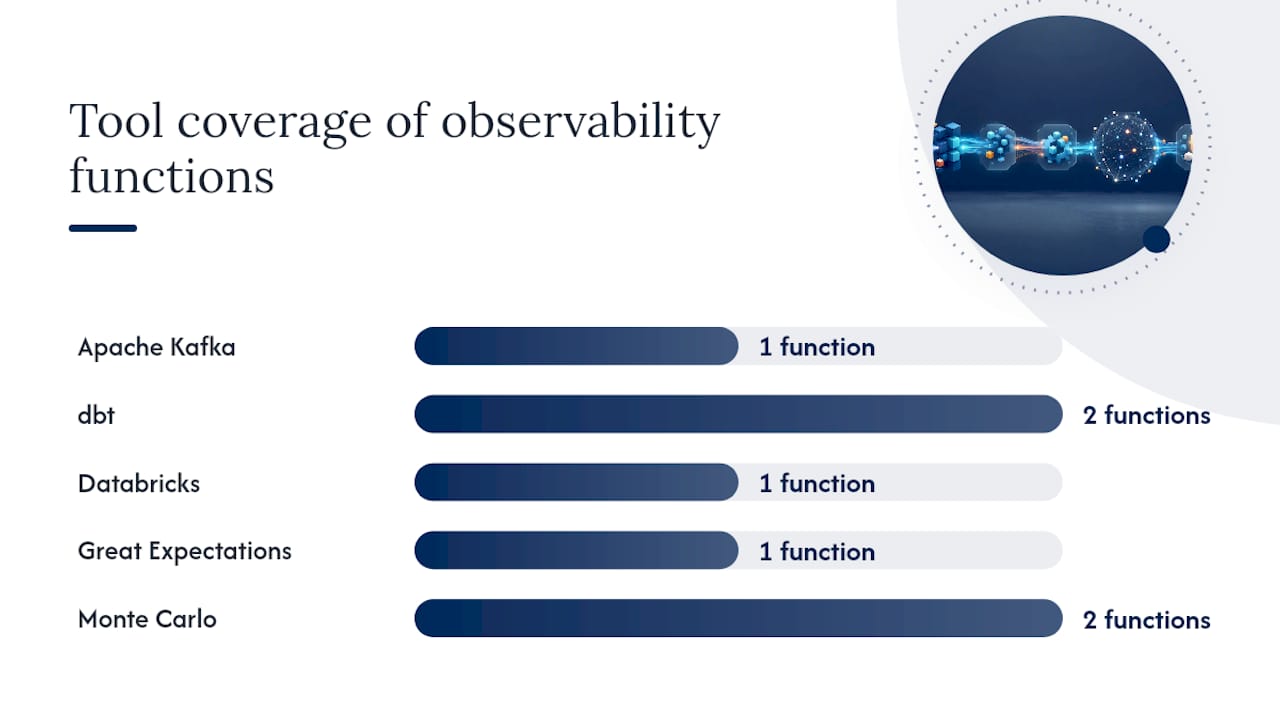
Tools divide responsibility across four functions: telemetry collection, lineage tracking, anomaly detection, and alert routing. No single tool covers all four equally well, which is why most production observability stacks combine two or three.
-
Apache Kafka (apache.org): The dominant streaming transport for high-volume pipelines. Kafka surfaces consumer lag, partition offsets, and retention metrics that observability systems should ingest as transport-layer telemetry. Best for teams running real-time or near-real-time data flows. The tradeoff is operational complexity; Kafka clusters require dedicated expertise to tune and monitor.
-
dbt: The standard transformation layer for analytics pipelines. dbt's run artifacts (manifest.json, run_results.json) and built-in test framework make it the most practical starting point for pipeline-level observability. Teams already using dbt get lineage and test results with minimal additional instrumentation. The limitation is scope: dbt observability covers the transformation layer only and requires complementary tooling for ingest and serving.
-
Databricks: A unified analytics platform that provides system tables with query history, cluster metrics, and job run metadata out of the box. For teams running large-scale Spark workloads, Databricks system tables are a rich source of execution telemetry. Enterprise licensing costs are a consideration for smaller teams.
-
Great Expectations: An open-source data quality framework that runs expectation suites against datasets and produces validation results. It fits the data quality pillar of observability and integrates with dbt, Airflow, and most orchestrators. Best used for point-in-time validation at pipeline checkpoints rather than continuous anomaly detection.
-
Monte Carlo: A commercial data observability platform that automates anomaly detection across freshness, volume, schema, and distribution without requiring manual threshold configuration. It is well-suited for enterprise teams that need rapid time-to-value and cross-tool lineage. The tradeoff is cost and vendor dependency.
-
OpenTelemetry: A vendor-neutral, CNCF-hosted standard for collecting traces, metrics, and logs from distributed systems. For data engineering teams, OpenTelemetry provides a consistent instrumentation layer that works across custom pipeline code, orchestrators, and serving APIs. It does not provide anomaly detection or lineage natively but is the right foundation for a composable observability stack.
Pro Tip: For government and regulated environments, prefer open standards like OpenTelemetry and W3C PROV-style provenance logging over proprietary telemetry formats. Vendor lock-in on observability data creates audit risk when contracts change.
Use-case guidance by team size and context:
- Small teams: Start with dbt tests and Great Expectations for data quality, plus freshness checks in your orchestrator. Add OpenTelemetry for custom pipeline code.
- Enterprise teams: Layer Monte Carlo or a comparable commercial platform on top of dbt and warehouse system tables for automated anomaly detection and cross-tool lineage.
- Government and compliance-heavy projects: Prioritize OpenTelemetry, append-only provenance logs, and dbt artifact capture. The analytics role in compliance for public agencies requires that every data decision be traceable to its source.
Scaling AI agents and orchestration patterns for alert routing are an active area; enterprise AI orchestration guidance offers useful framing for teams building automated remediation workflows on top of observability signals.
What common data problems does observability actually find?
Observability surfaces five classes of failure that static monitors routinely miss: freshness lag, schema drift, duplicate records, distributional drift, and partial writes. Each has a distinct signal pattern and a different likely root cause.
-
Freshness lag: Signal is a last-updated timestamp that exceeds the SLA window. Likely causes include upstream API throttling, scheduler failure, or a blocked Kafka consumer. Immediate mitigation is to trigger a manual backfill with a new run ID; long-term fix is to add a dead-man's-switch alert that fires before the SLA window closes.
-
Schema drift: Signal is a column addition, deletion, or type change detected by schema comparison against the previous run's manifest. Likely cause is an undocumented change in a source system. Immediate mitigation is to pause downstream consumers; long-term fix is to enforce schema contracts at the ingest boundary using tools like Great Expectations or dbt source tests.
-
Duplicate records: Signal is a row count that exceeds the expected range combined with a primary key uniqueness test failure. Likely cause is a retry without idempotency controls or a double-load from an orchestrator restart. Immediate mitigation is deduplication using a window function; long-term fix is to implement idempotent write patterns with run ID partitioning.
-
Distributional drift: Signal is a column statistic (mean, null rate, distinct count) that deviates beyond the established baseline. This is the failure mode most relevant to ML pipelines and RAG systems, where silent drift degrades model outputs without triggering any infrastructure alert. Long-term fix is to add column-level statistical monitoring with dynamic thresholds.
-
Partial writes: Signal is a row count that falls below the expected minimum for a partition. Likely cause is a network interruption or a source system that delivered an incomplete file. Immediate mitigation is to re-ingest the affected partition; long-term fix is to add a completeness check before the pipeline advances past the ingest stage.
Pro Tip: Treat every recurring anomaly as a specification gap. If the same schema drift fires three times, add a dbt source test that enforces the expected schema. The alert becomes a permanent quality gate.
Operational practices for alert routing, ownership, and auditability
The single most important operational rule is to route every actionable alert to the dataset owner with the error message, the affected run ID, a lineage link, and a runbook reference included in the notification body. A generic alarm sent to a shared channel is the primary driver of alert fatigue, and alert fatigue is the primary reason observability programs fail to deliver on their promise.
Practical ownership and routing rules:
- Assign a named owner (individual or team) to every dataset and pipeline at the time of creation, not as a retrofit.
- Tag every alert with the owning team's identifier so routing rules can filter without human triage.
- Include in every alert: the affected table name, the run ID, the timestamp of the anomaly, the expected versus observed value, and a link to the relevant lineage node.
- Define escalation paths: if the primary owner does not acknowledge within a defined window, escalate to the team lead with the same context payload.
For government pipelines, auditability is an architectural requirement, not an operational afterthought. A government pipeline case study documents the specific patterns agencies require to survive compliance review:
- Preserve original source values in a raw layer before any transformation touches them.
- Use dual-column patterns (e.g.,
value_rawandvalue_adjusted) so auditors can see both the source value and the derived value in the same record. - Implement append-only provenance logs that record every transformation applied, the code version, and the run ID.
- Store dbt manifest hashes alongside output tables so any production run can be replayed against the exact code that produced it.
W3C PROV-style provenance logging provides machine-readable lineage that serves as compliance evidence in regulated modernization projects. For federal and state agency pipelines, this is not optional.
Pro Tip: For teams using AI-assisted alert triage, AI strategy guidance for professional services covers ownership and escalation patterns that translate directly to data engineering alert routing.
The federal compliance guide for IT managers provides additional documentation requirements relevant to government pipeline auditability.
Technical and organizational challenges to plan for
The hardest challenges in a pipeline observability program are not technical: they are cost at scale, fragmented tooling across heterogeneous systems, and organizational resistance to ownership assignment. Teams that underestimate these factors instrument their pipelines and then abandon the program when alert volume becomes unmanageable.
Key risks and mitigations:
-
Data volume and cost: Collecting column-level statistics on every table in a large warehouse can generate significant query and storage costs. Mitigation: apply sampling for high-volume tables, set retention policies on telemetry data (90 days is a common starting point), and prioritize instrumentation on high-criticality datasets first.
-
Fragmented tooling: Most production pipelines span ingestion tools, orchestrators, transformation frameworks, and multiple storage layers. No single telemetry agent covers all of them. Mitigation: adopt OpenTelemetry as a common instrumentation standard and build a centralized metadata store that aggregates signals from each layer.
-
Schema heterogeneity: Partial updates, conflicting schemas across source systems, and privacy-suppressed values cause reliability failures more often than raw scale does. Architectures that enforce type safety from ingestion onward reduce audit friction significantly.
-
Incomplete lineage: Column-level lineage is difficult to capture automatically across SQL dialects and custom transformation code. Mitigation: start with table-level lineage from dbt and warehouse query logs, then add column-level lineage incrementally where it matters most (ML feature pipelines, compliance-critical datasets).
-
Alert fatigue: Covered in the operational practices section above. The mitigation is routing and context enrichment, not suppression.
-
Governance tension: Data ownership assignments and SLA definitions require cross-team agreement that engineering alone cannot drive. Mitigation: involve data consumers (analysts, ML engineers, product managers) in SLA definition from the start so ownership feels shared rather than imposed.
Major cloud infrastructure outages have shown that cascading failures can invalidate hours of pipeline computation when run identity and independent provenance are absent. Building those patterns in from the start is cheaper than retrofitting them after an incident.
How do you measure whether observability is working?
The top KPIs for observability maturity are mean time to detect (MTTD), mean time to repair (MTTR), false-positive alert rate, data SLA compliance rate, and downstream consumer impact count. Together, these five metrics tell you whether the program is delivering faster resolution, less noise, and fewer business-facing failures.
| KPI | Definition | Target Direction |
|---|---|---|
| MTTD | Time from failure onset to first alert firing | Decrease over time |
| MTTR | Time from first alert to pipeline restored | Decrease over time |
| False-positive rate | Alerts fired that required no action / total alerts | Decrease toward under 10% |
| SLA compliance rate | Pipelines meeting their freshness SLA / total pipelines | Increase toward — |
| Consumer impact count | Downstream consumers affected per incident | Decrease over time |
Lightweight instrumentation to compute these KPIs from observability signals:
- Log alert creation timestamp and resolution timestamp for every incident to compute MTTD and MTTR automatically.
- Tag every closed alert as "actionable" or "false positive" in your incident tool. Review the ratio weekly.
- Compare last-refresh timestamps against SLA definitions nightly and write the result to a compliance table.
- Track which downstream consumers query a table within the window following an incident to estimate impact count.
Provenance and append-only logs, as described by ICDEV's public sector modernization analysis, also serve as audit evidence that the observability program itself is functioning correctly — a requirement in regulated environments.
Your one-week plan for getting started with observability
The immediate first step is to inventory your pipelines and assign an owner to every dataset before touching any instrumentation. Ownership without instrumentation is more valuable than instrumentation without ownership.
One-week implementation plan:
- Day 1: List every production pipeline and its output datasets. Record the business owner, the engineering owner, and the expected refresh schedule for each.
- Day 2: Select the one pipeline with the highest downstream impact (the one whose failure would cause the most visible business problem). Confirm its SLA in writing with stakeholders.
- Day 3: Add freshness logging and row-count capture at the ingest and materialize stages of the pilot pipeline. Store results in a queryable table.
- Day 4: Capture dbt run artifacts (manifest.json, run_results.json) for the pilot pipeline and load them into a metadata table. Verify lineage is visible.
- Day 5: Configure one freshness alert and one volume anomaly alert for the pilot pipeline. Route both to the named owner with run ID and lineage link in the payload.
- Day 6: Run a tabletop exercise: simulate a freshness failure and walk through the alert-to-resolution path. Identify gaps in context or routing.
- Day 7: Document the SLA, ownership, and alert configuration for the pilot pipeline. This document is the template for every subsequent pipeline.
90-day milestones:
- Weeks 2–4: Expand instrumentation to the five highest-criticality pipelines using the same ownership and SLA model.
- Weeks 5–8: Add schema change detection and column-level distribution monitoring to all instrumented pipelines.
- Weeks 9–12: Implement a centralized metadata store and lineage graph covering all instrumented pipelines. Begin tracking MTTD and MTTR formally.
Public-sector IT modernization strategies that have succeeded in government programs consistently follow this phased, ownership-first pattern rather than attempting full-estate instrumentation in a single sprint.
Real-world cases where observability changed outcomes
Observability programs consistently produce the same result across industries: faster detection, shorter repair cycles, and fewer downstream consumers affected per incident. Three brief cases illustrate how that plays out in practice.
-
Government benefit-eligibility pipeline (auditability): A state agency running a benefits-determination pipeline discovered during a compliance review that it could not reconstruct which records had been processed during a partial file load. After implementing dual-column architecture, append-only provenance logs, and run ID tracking, the agency passed its next audit without a single finding related to data handling. The government pipeline case study documents the specific architectural patterns that made this possible. The operational change was simple: preserve originals, log every transform, and write run IDs into every output record.
-
ML feature store drift detection: A data team feeding a fraud-detection model noticed that model precision had declined over several weeks. No infrastructure alert had fired. Adding column-level distribution monitoring to the feature pipeline revealed that a source system had quietly changed the encoding of a categorical variable three weeks earlier. The fix took two hours once the root cause was visible. Without distribution monitoring, the team would have spent days investigating the model itself.
-
BI dashboard freshness remediation: An analytics team supporting executive reporting discovered that a key revenue dashboard was displaying data that was consistently 18–24 hours stale due to a scheduler misconfiguration. A freshness alert tied to the dashboard's SLA would have caught this on day one. After adding freshness monitoring and routing alerts to the pipeline owner, the team resolved the next three freshness incidents within 30 minutes each.
The pattern across all three cases is the same: the failure was silent, the detection was delayed, and the fix was fast once the right signal was visible. Observability does not prevent failures; it compresses the time between failure and resolution.
A practitioner's perspective on observability at scale
Most observability programs fail not because the tooling is wrong but because ownership is ambiguous. Teams instrument pipelines, configure alerts, and then watch those alerts route to a shared channel where no one feels responsible for acting. The technical work is the easier half.
The harder half is the organizational work: getting agreement on who owns each dataset, what the SLA is, and what "resolved" means for each class of failure. Government programs add a third dimension: auditability. Every transform must be reproducible, every original value must be preserved, and every run must carry a unique identity that survives a compliance review.
What Rutledge & Associates has observed across public-sector modernization engagements is that agencies that treat data quality as an architectural requirement from day one, rather than a testing phase concern, spend dramatically less time on audit remediation. The analytics role in contract success for government IT programs depends on pipelines that are not just fast but verifiable.
The tools covered in this guide — dbt, OpenTelemetry, Great Expectations, Databricks, Kafka, Monte Carlo — are all capable. The differentiator is not which tool a team picks; it is whether the team has defined ownership, SLAs, and auditability requirements before they write the first alert rule.
Primereadysub delivers outcome-owned observability for government pipelines
Government data pipelines carry compliance obligations that generic observability implementations do not address out of the box. Primereadysub, the public-sector modernization practice of Rutledge & Associates, delivers defined-scope observability implementations for state and federal agency pipelines, including instrumentation, lineage capture, dbt artifact pipelines, audit-ready provenance logging, and DevOps pipeline integration.
Rather than staff augmentation, Primereadysub owns the work package end-to-end: from ownership mapping and SLA definition through alert routing configuration and compliance documentation. Agencies in Maryland, New York, and Florida have used this model to achieve audit readiness without building a dedicated observability team internally.
For prime contractors managing complex, compliance-heavy programs, Primereadysub provides a low-oversight subcontracting model with clearly defined deliverables and measurable outcomes. To discuss a specific pipeline modernization or observability scope, contact Primereadysub directly.
Sources
- What is data pipeline observability? | dbt Labs
- Data Observability 101: A Complete Introduction
- Data Observability vs Monitoring: What's the Difference?
- Apache